

Using Python to See If My Portfolio Is Diversified (Most of the Article is Free)
How I Use Python to Find Hidden Risk in My Algo Portfolio

I Trade in TradeStation, But I Check My Portfolio With Python
More systems do not always mean more diversification. Sometimes Python shows me I am just taking the same trade in different ways.
Recently I had two index systems open at the same time.
On paper, that looked fine.
Two different strategies.
Two different signals.
Two separate backtests.
But watching both positions move against me at the same time made me ask the question I probably should ask more often:
Am I diversified, or am I just wearing two versions of the same trade?
That is the problem with counting the number of strategies.
A 12 system portfolio sounds diversified.
But if most of those systems are long stock indexes, trade similar timeframes, use similar logic, and lose money in the same market conditions, the portfolio may not be as diversified as it looks.
Five systems can still be one trade if they all need the same thing to happen.
That is why I started using Python to check my portfolio correlation.
Not because correlation fixes everything.
It does not.
A low-correlation loser is still a loser.
But knowing how related my systems are helps me see the risk hiding inside the portfolio before I add more of the same thing.
This was not just a random research question.
I had two systems open, both tied to the same general market, and both were moving against me. That is when diversification stops being a spreadsheet word and starts feeling real.
It is easy to say you have a portfolio when everything is closed.
It feels different when multiple systems are open and the account is moving the wrong way.
How I Would Use This
I would not use correlation as a simple pass/fail rule.
I look at this before I start trading a portfolio, and I also check it before making additions or subtractions to the portfolio.
If I am adding a system, I want to know whether it brings something different or just adds more of the same exposure.
If I am removing a system, I want to know what hole it may leave behind.
Correlation is not the only thing I look at, but it is one of the checks that keeps the portfolio from turning into a bunch of similar trades.
The Result From My Portfolio
I ran this check on my small portfolio of 12 strategies from my current portfolio.
The portfolio included systems like:
Corn Kepler
MBT Galaxy
MCL Cygnus
MES Monthly Seasonality
MES 600-minute systems
MES Turnaround Tuesday
MES WK3
MES Daily Extreme RSI
MNQ Phaedra
MNQ 600-minute system
MGC Breakout
The result was better than I expected.
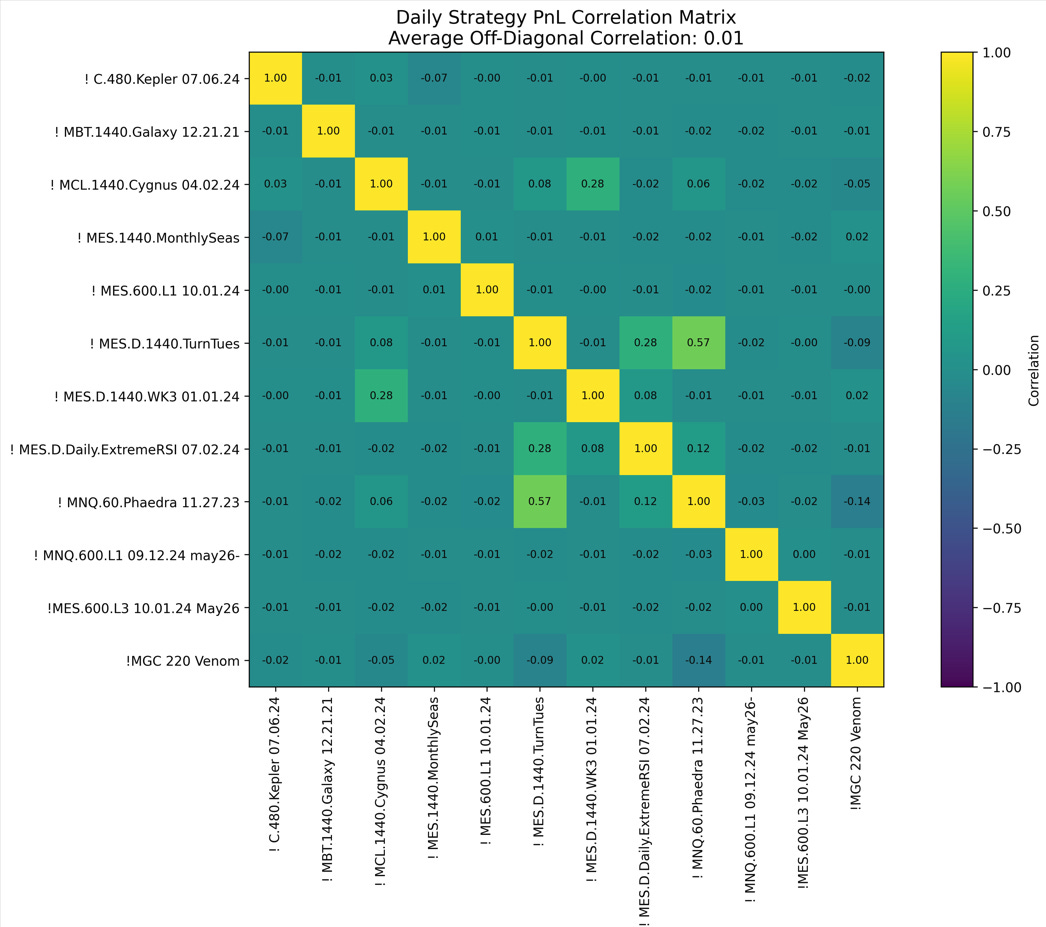
Daily average off-diagonal correlation: 0.01
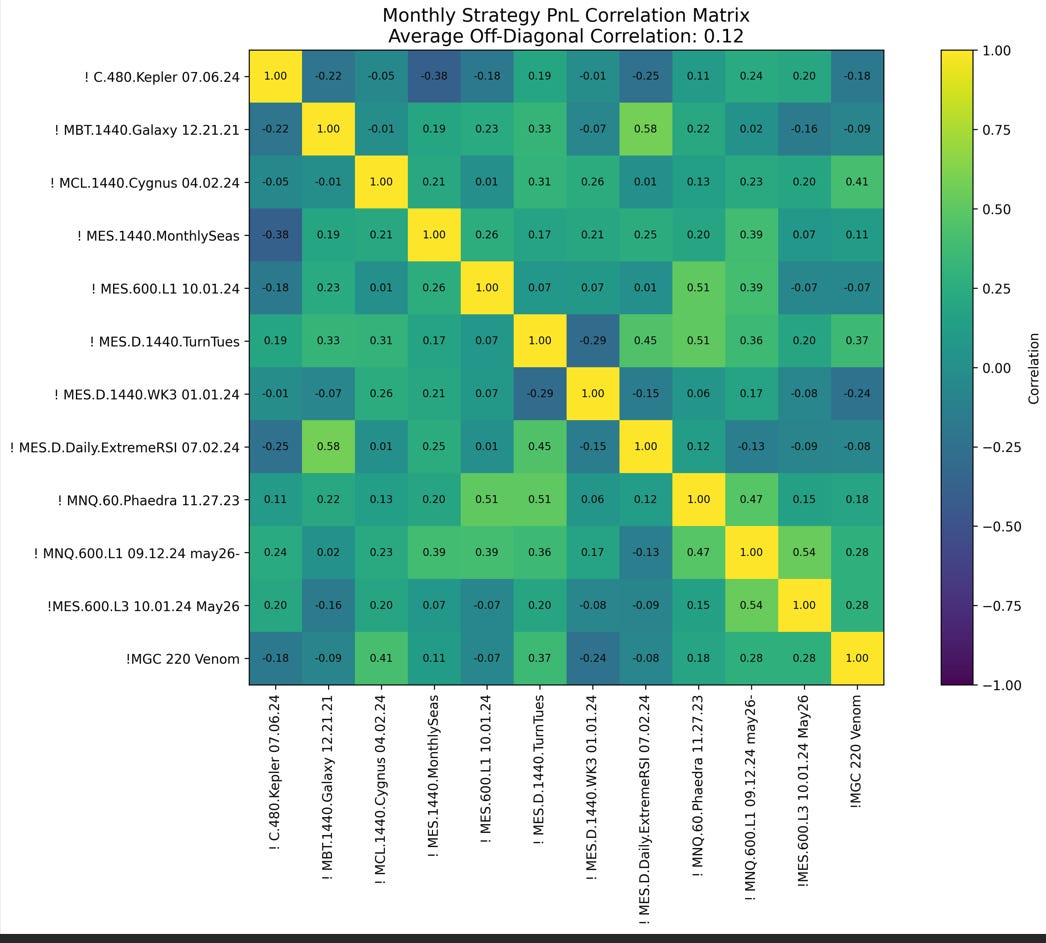
Monthly average off-diagonal correlation: 0.12
Pairs above 0.70: 0
The “off-diagonal” part just means I am ignoring the 1.00 values where each system is compared to itself.
So when the daily average came in at 0.01, that told me the systems were barely moving together on a day-to-day basis.
The monthly number was 0.12, which is still low.
That is what I want to see.
The portfolio is not acting like one giant trade.
But the average is not enough.
The Pairs I Still Need to Watch
The main daily pair that stood out was:
MES.D.1440.TurnTues / MNQ.60.Phaedra: 0.57
That is not a disaster.
But it is enough for me to watch.
If both of those systems fire at the same time, I do not want to pretend they are completely separate bets.
The next highest daily pairs were much lower:
MCL.1440.Cygnus / MES.D.1440.WK3: 0.28
MES.D.1440.TurnTues / MES.D.Daily.ExtremeRSI: 0.28
So from a same-day pain standpoint, the portfolio looked pretty clean.
Monthly had a few more pairs to watch:
MBT.1440.Galaxy / MES.D.Daily.ExtremeRSI: 0.58
MNQ.600.L1 / MES.600.L3: 0.54
MES.600.L1 / MNQ.60.Phaedra: 0.52
MES.D.1440.TurnTues / MNQ.60.Phaedra: 0.51
All of those fall into my “watch closely” bucket.
None were above 0.70.
Based on my own rules, I did not have any true “same risk bucket” pairs in this test.
But I did have a few relationships I need to respect.
The MES/MNQ systems are still index-heavy.
The MBT Galaxy / MES Extreme RSI relationship caught my attention too. Bitcoin and MES are different markets, but during this test window they lined up more than I would have guessed.
That is exactly why I like running this.
Python showed me something I may not have noticed from the individual strategy reports.
My Simple Correlation Guide
This is not a hard rule.
It is just how I sort the portfolio.
0.70 or higher: Similar risk bucket
0.50 to 0.70: Watch closely
0.25 to 0.50: Some relationship
0.00 to 0.25: Good diversifier
Negative: Interesting, but it still needs to make money
I do not automatically remove a strategy because it has high correlation.
Sometimes two good systems are still worth trading.
But I want to know when I am doing that.
If a MES system and a Bitcoin system are correlated, I should not pretend I have two unrelated bets.
I may have concentrated exposure.
That is good to know before both positions are open and moving against me.
I Want Low Correlation, Not Just More Systems
When I build a futures portfolio, I am not trying to collect strategy names.
I want different return streams.
Different markets.
Different timeframes.
Different logic.
Different ways to make money.
A long MES strategy and a long MNQ strategy may be two different systems, but they are still both tied to stock index risk.
A gold breakout system should behave differently.
An oil short should behave differently.
Corn, wheat, live cattle, bonds, and Bitcoin may all act differently at different times.
That is the portfolio I want.
Not 12 systems that all make and lose money together.
I want one system making new highs while another is in drawdown.
I want one market moving while another market is dead.
I want one setup cooling off while another starts working.
It helps me see whether I actually have different bets, or just a longer list of strategy names.
I Trade in TradeStation, But I Research in Python
Most of my strategies are built in EasyLanguage.
That is where I am comfortable coding the actual trading logic.
But Python is very good for checking the portfolio.
My workflow is simple:
Export each strategy’s PnL from TradeStation.
Put the files into one folder.
Let Python read the whole folder.
Build daily and monthly PnL tables.
Run correlations between all systems.
Look for hidden overlap.
I am not trying to rebuild my entire trading operation in Python.
I am using Python to answer one question:
Are these systems actually different?
A strategy can look great by itself and still be a poor addition to the portfolio.
That is the part I care more about now.
A Good Strategy Report Is Not Enough
A single strategy report can fool you.
A system might have:
solid net profit
good profit factor
acceptable drawdown
smooth looking equity curve
That does not mean I should add it.
The better question:
What does this strategy add to what I already trade?
If I already have multiple long index systems, another long index system might add more heat than diversification.
Even if the backtest looks good.
Even if the report checks a lot of boxes.
Even if the system is profitable.
I do not just want the next best backtest.
I want the next system that fills a void.
The Python File
Here is the simplified version of the Python file I use for this.
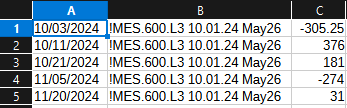
My file structure is simple:
Column A: Date
Column B: Strategy name
Column C: PnL
No header row
Each file is one strategy export
The code reads every file in the folder, combines the systems, creates daily and monthly PnL tables, runs correlations, prints the pair list, and creates the heatmaps.
.
import pandas as pd
import numpy as np
import matplotlib.pyplot as plt
from pathlib import Path

# =========================================================
# Strategy Correlation Checker
# =========================================================
# This script reads every strategy file in one folder.
#
# My file structure:
# Column A = Date
# Column B = Strategy name
# Column C = PnL
#
# No header row.
# Each file is one strategy export.
# =========================================================

folder_path = Path(r"C:\Users\trade\OneDrive\Desktop\Equity") #Use your own folder path

file_types = ["*.csv", "*.txt", "*.xlsx", "*.xls", "*.ods"]

all_data = []

# ---------------------------------------------------------
# 1. Read every strategy file in the folder
# ---------------------------------------------------------

files = []

for file_type in file_types:
    files.extend(folder_path.glob(file_type))

print(f"Files found: {len(files)}")

for file in files:
    print(f"Reading: {file.name}")

    try:
        if file.suffix.lower() in [".xlsx", ".xls", ".ods"]:
            df = pd.read_excel(
                file,
                header=None,
                usecols=[0, 1, 2]
            )
        else:
            df = pd.read_csv(
                file,
                header=None,
                usecols=[0, 1, 2]
            )

        df.columns = ["Date", "Strategy", "PnL"]

        df["Date"] = pd.to_datetime(df["Date"], errors="coerce")
        df["Strategy"] = df["Strategy"].astype(str).str.strip()
        df["PnL"] = pd.to_numeric(df["PnL"], errors="coerce")

        df = df.dropna(subset=["Date", "Strategy", "PnL"])

        # If the Strategy column is blank, use the file name
        df.loc[df["Strategy"].isin(["", "nan", "None"]), "Strategy"] = file.stem

        all_data.append(df)

    except Exception as e:
        print(f"Skipped {file.name}: {e}")

if not all_data:
    raise ValueError("No usable strategy files were loaded.")

# ---------------------------------------------------------
# 2. Combine all strategy files
# ---------------------------------------------------------

trades = pd.concat(all_data, ignore_index=True)

trades = trades.sort_values(["Date", "Strategy"])

print("\nCombined preview:")
print(trades.head())

# ---------------------------------------------------------
# 3. Create daily PnL table
# ---------------------------------------------------------
# Rows = dates
# Columns = strategies
# Values = daily PnL
# ---------------------------------------------------------

daily_long = trades.groupby(
    ["Date", "Strategy"],
    as_index=False
)["PnL"].sum()

daily_pnl = daily_long.pivot_table(
    index="Date",
    columns="Strategy",
    values="PnL",
    aggfunc="sum"
).fillna(0)

daily_pnl = daily_pnl.sort_index()

# ---------------------------------------------------------
# 4. Create monthly PnL table
# ---------------------------------------------------------

monthly_long = daily_long.copy()

monthly_long["Month"] = (
    monthly_long["Date"]
    .dt.to_period("M")
    .dt.to_timestamp()
)

monthly_long = monthly_long.groupby(
    ["Month", "Strategy"],
    as_index=False
)["PnL"].sum()

monthly_pnl = monthly_long.pivot_table(
    index="Month",
    columns="Strategy",
    values="PnL",
    aggfunc="sum"
).fillna(0)

monthly_pnl = monthly_pnl.sort_index()

# ---------------------------------------------------------
# 5. Helper functions
# ---------------------------------------------------------

def average_off_diagonal(corr):
    """
    Average correlation between different strategies.
    This removes the 1.00 values where each strategy
    is compared to itself.
    """

    corr_copy = corr.copy()

    for col in corr_copy.columns:
        corr_copy.loc[col, col] = np.nan

    return corr_copy.stack().mean()


def corr_bucket(value):
    if value >= 0.70:
        return "Same risk bucket"
    elif value >= 0.50:
        return "Watch closely"
    elif value >= 0.25:
        return "Some relationship"
    elif value >= 0.00:
        return "Better diversifier"
    else:
        return "Negative Correlation"


def make_pair_table(corr):
    """
    Turns the correlation matrix into a clean list:
    Strategy 1, Strategy 2, Correlation, How I Treat It
    """

    corr.index.name = "Strategy_1"
    corr.columns.name = "Strategy_2"

    pairs = corr.stack().reset_index()
    pairs.columns = ["Strategy_1", "Strategy_2", "Correlation"]

    # Remove self-comparisons
    pairs = pairs[pairs["Strategy_1"] != pairs["Strategy_2"]]

    # Remove duplicate mirror pairs
    pairs["Pair"] = pairs.apply(
        lambda row: tuple(sorted([row["Strategy_1"], row["Strategy_2"]])),
        axis=1
    )

    pairs = pairs.drop_duplicates("Pair").drop(columns="Pair")

    pairs = pairs.sort_values("Correlation", ascending=False)

    pairs["Correlation"] = pairs["Correlation"].round(2)
    pairs["How I Treat It"] = pairs["Correlation"].apply(corr_bucket)

    return pairs


def plot_heatmap(corr, title):
    fig, ax = plt.subplots(figsize=(12, 9))

    im = ax.imshow(corr, vmin=-1, vmax=1)

    ax.set_xticks(range(len(corr.columns)))
    ax.set_yticks(range(len(corr.index)))

    ax.set_xticklabels(corr.columns, rotation=90)
    ax.set_yticklabels(corr.index)

    for i in range(len(corr.index)):
        for j in range(len(corr.columns)):
            value = corr.iloc[i, j]

            if pd.notna(value):
                ax.text(
                    j,
                    i,
                    f"{value:.2f}",
                    ha="center",
                    va="center",
                    fontsize=8
                )

    plt.colorbar(im, ax=ax, label="Correlation")
    ax.set_title(title)

    plt.tight_layout()
    plt.show()


# ---------------------------------------------------------
# 6. Run daily and monthly correlation checks
# ---------------------------------------------------------

for label, pnl_table in {
    "Daily": daily_pnl,
    "Monthly": monthly_pnl
}.items():

    # Remove strategies with no variation
    pnl_table = pnl_table.loc[:, pnl_table.std() != 0]

    corr = pnl_table.corr()

    avg_corr = average_off_diagonal(corr)
    pair_table = make_pair_table(corr)

    print("\n" + "=" * 80)
    print(f"{label.upper()} CORRELATION REPORT")
    print("=" * 80)

    print(f"\nStrategies used: {len(pnl_table.columns)}")
    print(f"Periods used: {len(pnl_table)}")
    print(f"Average off-diagonal correlation: {avg_corr:.2f}")

    print(f"\n{label} correlations highest to lowest:")
    print(pair_table.to_string(index=False))

    plot_heatmap(
        corr,
        f"{label} Strategy PnL Correlation\n"
        f"Average Off-Diagonal Correlation: {avg_corr:.2f}"
    )
Pandas pivot_table() is the part that turns the raw TradeStation style export into a table with dates as rows and strategies as columns. Then DataFrame.corr() calculates the pairwise correlations between those strategy columns.
Daily or Monthly?
I like checking both.
Daily correlation tells me which systems may hurt me together in real time.
Monthly correlation tells me how the systems fit together over bigger reporting periods.
My simple way to think about it:
Monthly correlation: portfolio fit
Daily correlation: same-day pain
Both high: same risk bucket
Monthly low, daily high: may diversify over time, but still hurt together short term
Daily low, monthly high: day to day noise differs, but the systems may still need the same bigger regime
That is why I run both.
If I had to show one in a blog post, I would probably lead with monthly.
If I am managing live exposure, I care a lot about daily too.
How I Would Use This
I would not use correlation as a simple pass/fail rule.
I would use it to make better decisions.
If two strong systems are highly correlated, I may still trade both.
But I would treat them as one risk bucket.
If I am choosing between another long index system and a commodity system with similar quality, I may lean toward the commodity system.
If several systems are open at the same time and they all depend on the same market move, I need to respect that exposure.
If a new strategy has lower correlation and solid performance, it may deserve more attention even if it is not the prettiest standalone backtest.
That is where Python helps me.
It does not build the portfolio for me.
It keeps me from lying to myself about the portfolio.
Final Thought
More strategies does not always mean more diversification.
Sometimes it just means more ways to be wrong at the same time.
That is what I am trying to avoid.
In this test, my 12-strategy portfolio looked diversified overall.
The average daily correlation was 0.01.
The average monthly correlation was 0.12.
No pair was above 0.70.
But a few pairs were above 0.50, and those are the ones I want to watch when they fire together.
That is why I run this check before I get too excited about adding another system.
It does not tell me the future.
It does not make a bad strategy good.
But it does help me see whether my portfolio is actually spread out, or whether I am just taking the same trade in different ways.
Paid Member Bonus: TradeStation Export Code
The Python script only works if I can get clean strategy PnL files out of TradeStation.
That is where this EasyLanguage export code comes in.
This is the strategy I use to export closed-trade daily PnL into the folder Python reads.
Save it as a strategy, not an indicator.
Use your own output folder.
Make sure the exported file structure matches the Python script:
Date
Strategy
Closed PnL