

Peak Trading Research Review: Part 1
Testing Peak10 Strategies Released in 2022

I’ve been curious for a long time how Peak Algo’s strategies would hold up over the long run. Peak launched its Peak10 portfolio in May 2022, and since then Dave Whitcomb has delivered a set of ten Easy Language systems every month. Now, with nearly four years of live out-of-sample performance to study, we can try to answer the big question: do these strategies actually work in real time, and can they be used to build a robust trading portfolio?
Who (and what) is Peak Trading Research?
If you’re not familiar, Peak Trading Research is a commodity-focused research firm founded by Dave Whitcomb, CFA, who previously ran agricultural trading for Koch and macro research for Cargill.
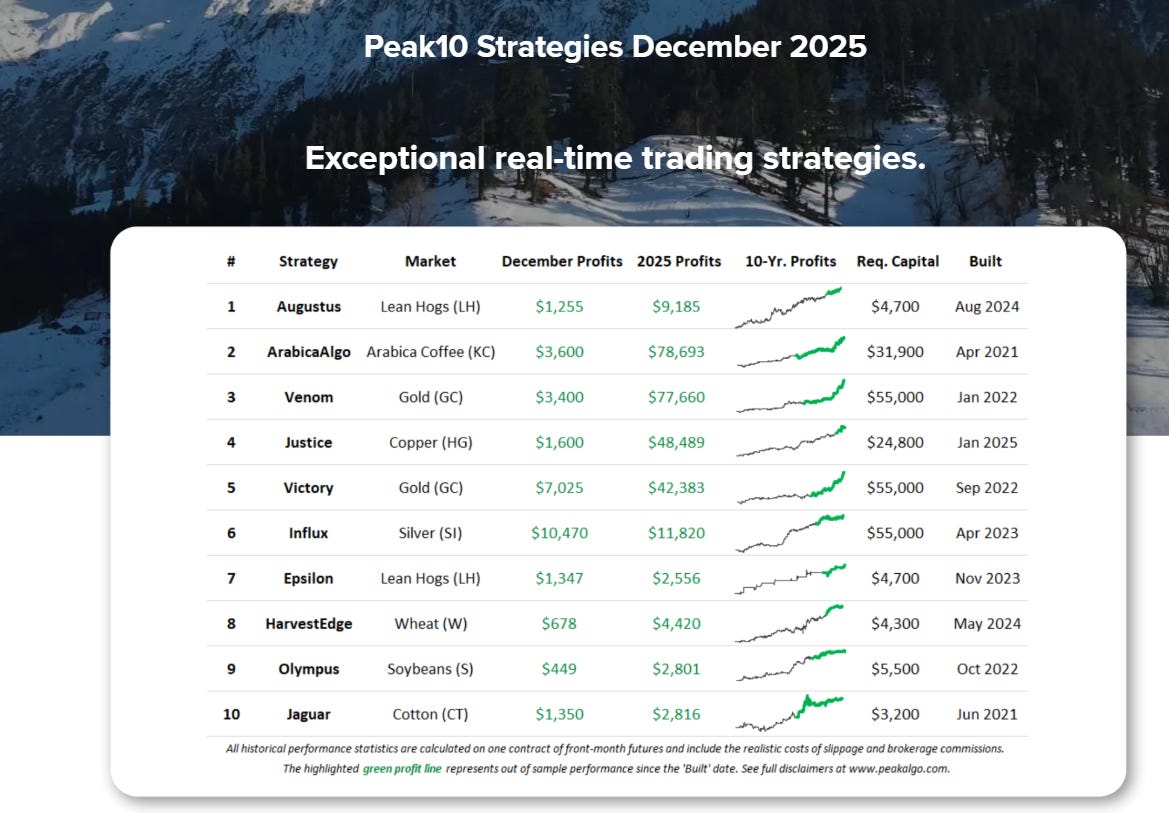
Peak10 is their “best of the best” list of Easy Language trading systems — a rotating portfolio of ten strategies with strong long-term backtests and solid recent real-time performance.
PeakAlgo.com is the store front that sells the Peak10 packages: you get the ELD/TXT code, TradeStation workspaces, and quick-start documentation.
On top of that, they publish a free algo trading course and a “Strategy of the Month” series on YouTube, where they walk through complete example systems like crude oil breakouts, cocoa mean reversion, Bollinger/Keltner setups, rice systems, and more.
Peak’s Stated Process
According to Peak, their research process looks like this:
Test millions of strategies across markets and timeframes.
Incubate the most promising systems on fresh out-of-sample data.
Promote the best performers into the monthly Peak10 list, but only if they have:
Strong long-term performance (10+ year backtest), and
A profitable prior month in real-time.
What I’m Actually Showing Here
I’m not going to show any of the paid Peak Algo strategy code. Everything in this series is either:
Out-of-sample equity curves for Peak10 strategies, with commissions and fees included, not the code.
I’m not affiliated with Peak Trading Research or PeakAlgo in any way. I’m just a trader who bought Peak10, and tested it.
Lets get into it.
Since a large amount of peak algos are used over the last 4 years, I am going over all the 2022 strategies in this article.
First, I wanted to see the winners & losers using all Out of Sample data. I used 2023-present day to see how the strategies have performed. I know most traded live before this date but I wanted a quick way to see the performance.
Out of the 54 tested strategies in 2022 there were:
23 winning strategies and 31 losing strategies
Note: I may have missed a few
From “Trade Everything” to “Trade the Best”
To start, I did the most basic thing you can do… I ran all the 54 Peak10 Strategies. I saw what they all did in 2023 and 2024 since thats all out of sample.
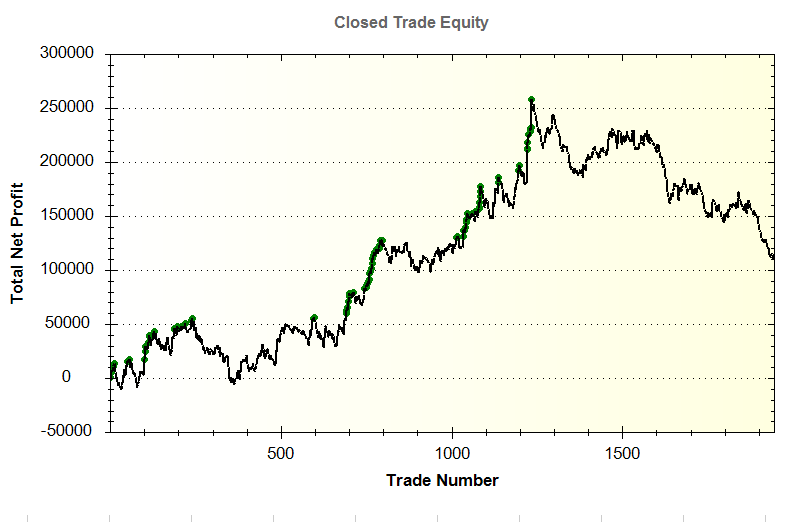
The equity curve looks pretty good at first glance – a steady climb up to around $250k in open profits before a long, choppy slide lower which I thought was strange. When the smoke cleared, the combined portfolio finished 2023 up about $109,000.
Sounds ok… until you look at the risk:
Intraday max drawdown: about –$204,000
Trade-close max drawdown: about –$147,000
Required capital to run everything: roughly $1.4 million (possibly more)
In other words, you tied up $1.4M, sat through a huge –$200k DD, and ended the year with about $109k in profit. That’s roughly a 0.5 PnL/DD ratio and a single-digit return on capital. For most retail traders, that’s simply not worth the stress or the margin.
This is the core problem: “Trade everything” is not a great strategy.
Can we do better.
I hope.
Which isn’t a strategy either.
Next I Killed the Losers
The first filter was brutal on purpose.
I went through all the Peak systems and dropped anything that lost more than $10,000 in 2023 on one contract. No fancy stats, just:
“If you lost more than ten grand in a single year, you’re out.”
That alone slashes a big chunk of the capital requirement. We’re no longer trying to support everything Peak has ever published; we’re keeping the stuff that at least put up a decent fight in a tough year. We are basically incubating these strategies for a year plus.
And Next I Let the Software Build Portfolios
With the losers removed, I fed the remaining systems into my portfolio software (which I have mentioned before in an article, click link below) and had it search for combinations that maximize 2023 PNL/DD.
https://trademaid.info/pa.html
So instead of just “who made the most money,” I’m asking:
“Which combination gives the most profit / DD.”
The software tried different mixes of systems and handed back the best candidates
The Best Portfolio based on PNL/DD
The “winner” portfolio (highlighted in blue in my screenshot) looks like this:
15 systems across multiple markets
Required capital: about $168,000
2023 net profit: about $134,000
Fitness (PnL / DD): 17.44
Profit factor: 1.69
Average trade: $252
Number of trades: 532


On a backtest of 2023:
Capital requirement drops from $1.4M → $168k
Profit only drops from $109k → $134k (because we’re no longer carrying all the dogs)
PnL per unit of drawdown improves massively
This is the kind of portfolio a normal human with a six-figure account or possibly less can actually consider trading. And you are well diversified with 13 different markets.
Now for the Good Stuff
Here are the actual trades for 2024. Once again, I simulated what happens if you just turn every Peak strategy on and let them all run. It’s rough. The portfolio finishes the year down almost $100,000 with a max intraday drawdown of about $202,000.
Could we have done a few things to make that look better? Sure. But that’s the point. This is what “trade all the Peak strategies you could have traded” actually looks like, before any filtering or portfolio construction.
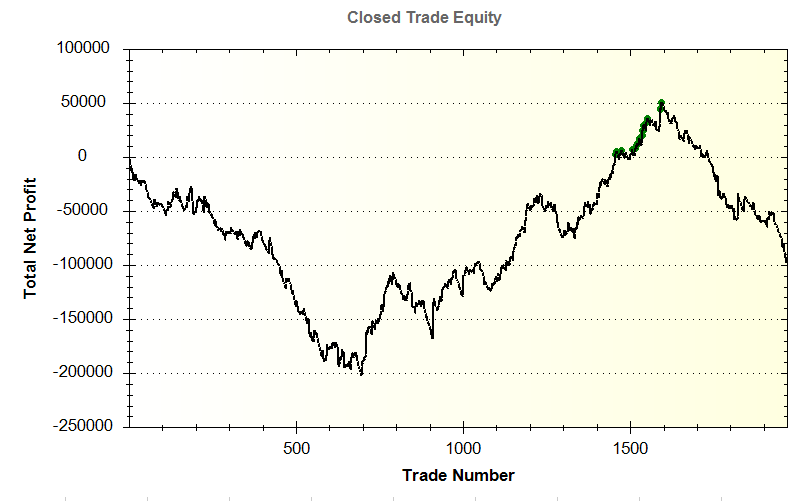
There were plenty of winners, but even more losers: 22 profitable strategies and 32 that lost money. Two years out, it’s been a pretty rough stretch for the raw, unfiltered Peak.
So the real question is: how did our filtered portfolio do over the same period?
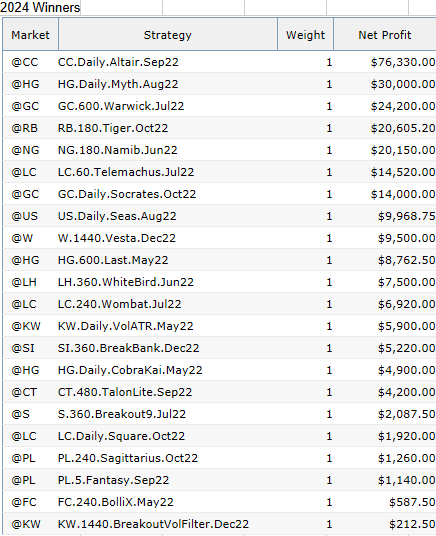
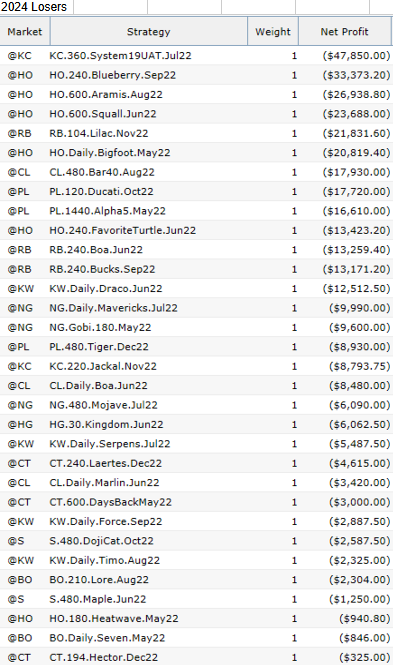
Here are the winners and losers below for 2024
The equity curve for that “Best PnL/DD 2023” portfolio isn’t a straight line up. 2024 starts rough — you spend the first ~200 trades chopping sideways to down, and only then does the portfolio catch a series of strong runs and grind higher into year-end. Psychologically, that’s the reality of systematic trading: you suffer first, then (hopefully) get paid, sometimes.
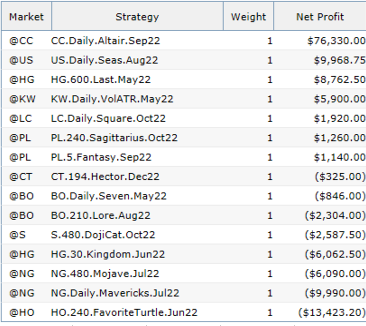
Here are the strategies that made up that portfolio:
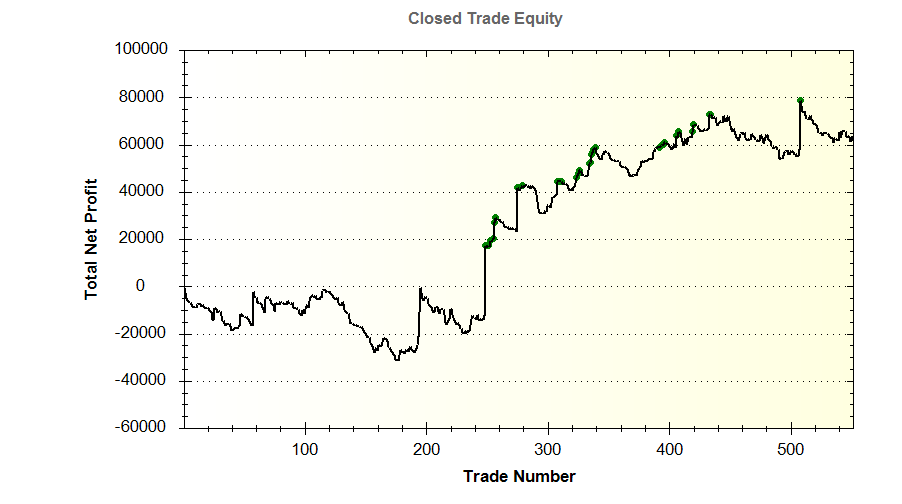
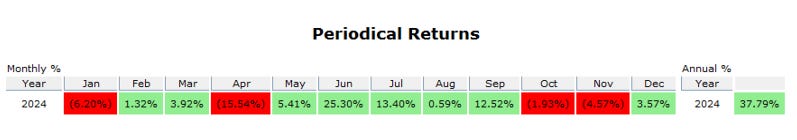
The important part is what this looked like in real money terms. In 2024, this filtered Peak portfolio returned about 37% on $168,000 of capital, with:
Net profit: $63,653
Max drawdown: $31,516
PnL / DD: ~2.0
Sharpe ratio: 0.39
Sortino ratio: 0.70
We may have gotten a little lucky with cocoa. CC futures went absolutely nuts, and that single market contributed a big chunk of the overall profit. The good news is that we were still diversified across plenty of other contracts, so it wasn’t a pure one-trick pony — but it’s fair to ask: could we do this again?
Honestly, I don’t know. I’m not here to BS you. I’m just showing you how these portfolios have behaved in real time. This is trading: there’s path dependency, regime shifts, and sometimes one market carries the team.
For now, let’s keep testing. We’ll call this last one the Large Portfolio.
Next up: let’s see what happens if we build a small/medium Peak portfolio instead.
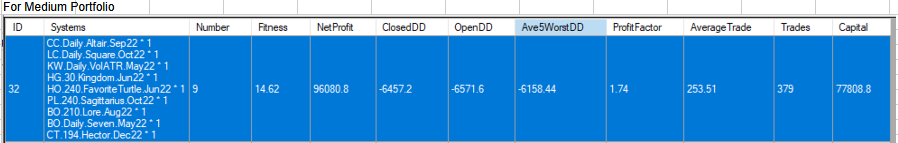
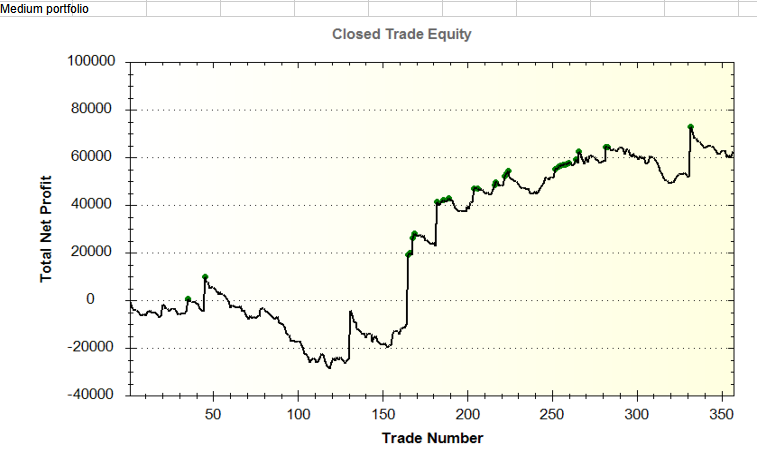
The small/medium portfolio told a similar story. On paper it did even better, showing an 80% gain in 2024:
PnL: $62,449
Max DD: $38,862
Required capital: $77,808
But there are two big asterisks:
I picked this basket somewhat randomly, and once again it included cocoa, which did a lot of the heavy lifting.
In real life, I think $77k is too low for this level of leverage. With 9 strategies trading both long and short across volatile futures, you’d almost certainly get hit with margin calls or hit a pain point where you just stop trading.
So yes, the numbers look great. But they’re not a “just do this and get 80% a year” recipe — they’re a look of what’s possible when you’re selective, diversified, and maybe a little lucky.
I’m going to put a hard stop here and call this Part 1. Coming soon Part 2 (and maybe Part 3 and beyond).
If you like this kind of breakdown, let me know!
Thanks for reading!
An interesting analysis of the Peak Algo strategies in OOS results. Thanks for posting.
Many of the PA strategies hold for far too long for my trading psychology comfort because they can hold trades open for months at a time. For me, my sweet spot is between 2 and 10 days of hold time. So, where I have subscribed to PA in the past, I have used a very small handful of the strategies by taking advantage of the edge and changing the exits to x number of higher highs (Long), or lower lows (Short), or max number of bars held, etc. that I typically use for my automated trading.
Looking forward to seeing Part 2 of the series.