

Living in Drawdown: What Bitcoin’s Pain Profile Really Looks Like
A data-driven look at Bitcoin’s worst crashes—and how our rules-based strategy aims to beat HODL.

Bitcoin hasn’t just been volatile, it has spent long stretches in deep drawdowns from the highs. Since 2017, two drawdowns have lasted over two years, and three others have dragged on for six months or more. IF you are a long-term holder you have to be prepared for that kind of pain and volatility.
In the tables and charts below, I’ll show exactly how deep and how long these drawdowns have been, with the numbers to back it up.
How Much Time Does Bitcoin Spend in Drawdown?
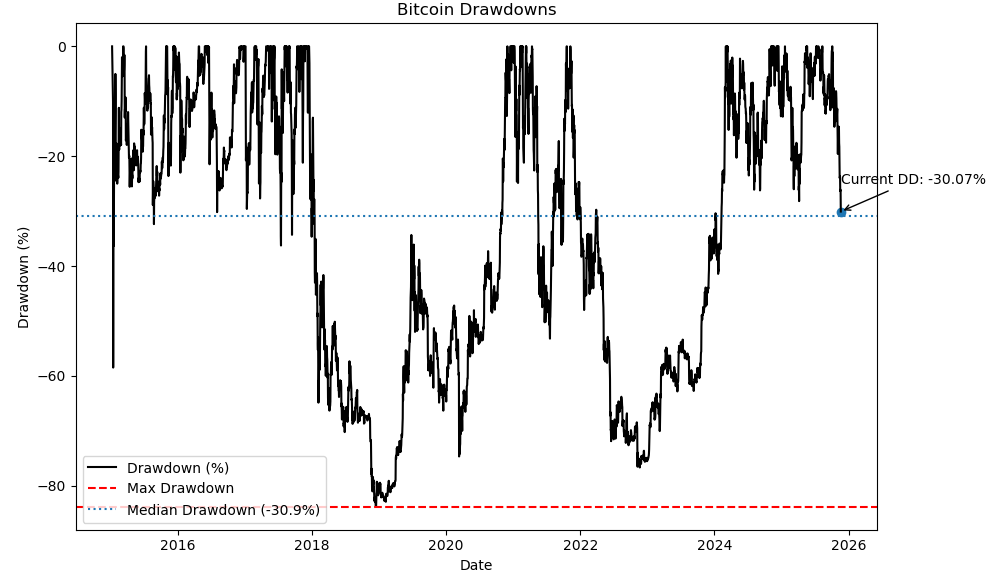
Since 2015, using daily closing prices from FRED’s CBBTCUSD series, Bitcoin has spent 3,770 out of 3,964 days in drawdown—about 95% of the time it has been below an all-time high. The median drawdown over this period is a whopping −31%.
The maximum drawdown in this sample was −83% on December 15, 2018, and it took 716 days to fully recover from that level and make new highs.
Bitcoin has hit a 30% drawdown or more on 21 separate occasions.
It has been in a 30%+ drawdown for a total of 1,904 days (~48% of the time).
It has been in a 40%+ drawdown for 1,682 days (~42% of the time).
Flipping this around, Bitcoin has been at a new all-time high for only 194 days, or about 4.9% of the time. That’s pretty wild for an asset that gets so much attention.
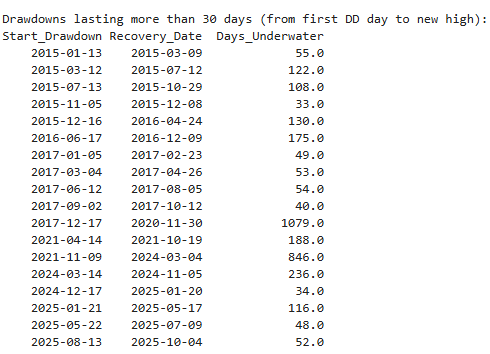
Below are all the days, and how long Bitcoin has been in a drawdown, for episodes lasting more than 30 days.
How Often Does Bitcoin Drop 10% to 90% From a High?
Next, instead of looking at time spent in drawdown, we can count how often Bitcoin falls through different drawdown levels.
Here we look at threshold crossings: every time the drawdown crosses below a given level (−10%, −20%, −30%, etc.) from above, we count that as an “event.” This can happen multiple times within the same broader bear market if price chops around the threshold.
Below are all the days Bitcoin spent in drawdowns deeper than −10%, and how long each of those episodes lasted. Summarizing those episodes by their first crossing of each threshold gives the event counts below.
A few things stand out:
Shallow drawdowns (10–20%) happen all the time.
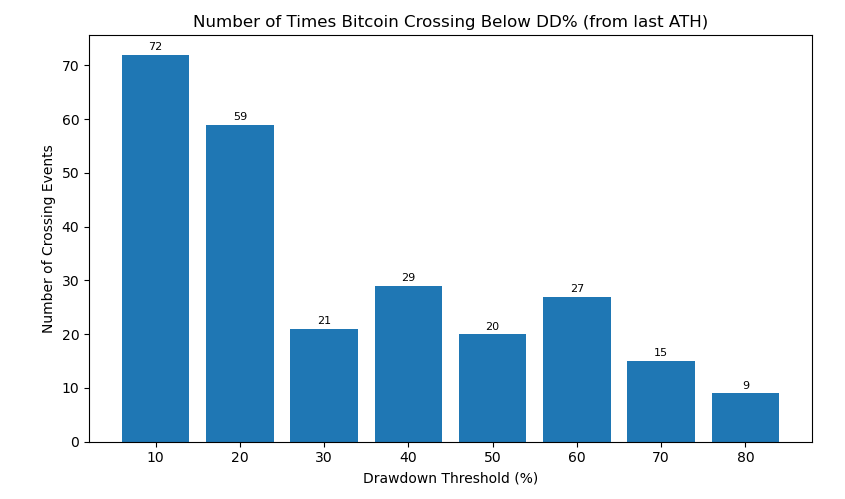
Bitcoin has crossed below a 10% drawdown 72 times and below a 20% drawdown 59 times. In other words, a 10–20% drop from the highs is basically “normal noise” for this asset, not a crisis.
The drop-off after 20% is sharp.
Once you get to 30% or more, the count drops to 21 events, and it never gets back to those 10–20% frequencies again. That’s a nice way to quantify “true pain” versus routine volatility.
Big drawdowns are rarer, but not that rare.
40%+ drawdowns: 29 events
50%+ drawdowns: 20 events
60%+ drawdowns: 27 events
70%+ drawdowns: 15 events
80%+ drawdowns: 9 events
Remember, these are threshold crossings, not just days spent at that level. An 80% drawdown doesn’t show up once in the chart—it reflects the moments when the market first falls through −80% from a prior high during a given move. In a choppy bear market, Bitcoin can slice through a level, bounce back above it, and then break through again, adding multiple threshold-crossing events over time.
Because of that path dependence and choppiness, the pattern isn’t perfectly smooth—and that’s okay. You might expect a clean staircase (fewer events as you go deeper), but it’s bumpier than that: 40% events outnumber 30%, and 60% outnumber 50%. Once a bear market gets going, it can slice through several thresholds in quick succession and revisit them multiple times.
Takeaways
If you’re holding spot BTC, a 10–20% pullback is part of the game. It happens a lot.
30–60% drawdowns are not freak accidents—they’ve happened dozens of times in Bitcoin’s life.
The truly catastrophic-looking 70–80%+ declines are less frequent, but they’re still a part of the cycle.
This chart pairs nicely with the time-in-drawdown stats: not only does Bitcoin frequently fall through these thresholds, it often stays below them for long periods. That’s the pain you’re enduring as a long-term holder.
A Quick Look at the Earlier Bitcoin Drawdowns
I did not gather all the historical data for Bitcoin, but here’s a quick look at some other major drawdowns before December 2015 from other sources.
It’s worth noting that the period since 2015 isn’t even the worst that Bitcoin has seen. Earlier cycles were even more violent, both in depth and duration.
2011 crash – the original wipeout
In Bitcoin’s first major bubble, price collapsed by roughly 93% from the 2011 peak to the bottom later that year. (Source: Newhedge)
One estimate shows it took about 460+ trading days to fully recover back to new highs. (Source: PortfoliosLab)
2013–2015 “crypto winter”
After topping out around late November 2013, Bitcoin entered a brutal multi-year bear market. Depending on the data source, the max drawdown in this period landed between −76% and −85%, and the drawdown lasted from about 13 months to more than 3 years before a decisive recovery. (Source: Curvo)
Zooming out over the full history, research from multiple shops (NYDIG, iShares, others) points to four major Bitcoin cycles—peaking in 2011, 2013, 2017, and 2021—each followed by drawdowns of roughly 75–90% from peak to trough. (Source: NYDIG)
What This Means for Quant Traders
Looking at these return numbers, it’s clear that we don’t have to simply accept Bitcoin’s brutal ups and downs. With even simple, rules-based approaches, we can potentially sidestep these long drawdowns—or use them as opportunities to scale in for the long term when fear is maxed out.
As quant traders, we might hold Bitcoin or we might not, but we share the same objective: beat the HODLers. That can mean:
Generating higher returns than buy-and-hold,
Running at much shallower and shorter drawdowns,
Or, ideally, achieving both.
Become a Founding Member
We will be sharing a Bitcoin strategy for founding members that has been live since December 2021.
This is not buying or selling advice. We are just going over the numbers to see what the drawdowns look like in relation to other historical Bitcoin drawdowns.
Data used: FRED CBBTCUSD series: https://fred.stlouisfed.org/series/CBBTCUSD